Electrification of Cargo Ship Propulsion
Study Case for Indonesia
Recent Study on electric shipping
Background
Two recent studies have brought a new perspective on the feasibility of electrifying maritime transportation. The first study by Kersey et al. (2022) [2] showed that at battery price of US$ 100kWh, the electrification of intra-regional trade routes of less than 1,500 km is economical with minimal impact to ship carrying capacity. If battery achieve a price of US$ 50kWh, the economical range nearly doubles. Similiarly a second study by Kistner et al. (2023) [1] mentioned that the application of battery-electric propulsion system is found not to be limited by the vessel Size but mostly by the operated passage length. While distance of up to 15,000 km are technically achievable, economic limitations are effectively reducing the area of application to a maximum of 10,000 km. However when comparing battery solutions with conventional desel combustion engines, economic competitiveness is only observed for passages of up to 2,500 km when including a carbon tax and forecasting optimistic battery development.
Case for Indonesia
In Indonesia, a nation where maritime routes are the lifeline of our archipelago, make this finding very interesting.
What if we could electrify our maritime transportation? How feasible is it and What is the limitation?
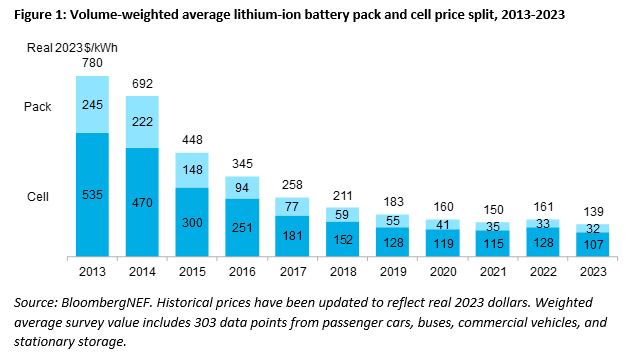
Considering that the trajectory of falling battery price in the last decade, in the near future this could be the key to decarbonize our maritime transportation.
 Borrowing the approach from Kistner et al. (2023) [1],
this writing tries to estimate the feasibility of electrifying the maritime transportation in Indonesia.
Economic and physical models are used for the evaluation.
For this purpose, KM Logistik Nusantara 5 serving the T-10 route from the Indonesia's 'Sea-Toll' program
[6]
is taken for the study.
This route is one with the highest volume routes within this program.
It serves the eastern part of Indonesia, notably the North Maluku group of islands. The detail of the route is presented in below map and table.
Borrowing the approach from Kistner et al. (2023) [1],
this writing tries to estimate the feasibility of electrifying the maritime transportation in Indonesia.
Economic and physical models are used for the evaluation.
For this purpose, KM Logistik Nusantara 5 serving the T-10 route from the Indonesia's 'Sea-Toll' program
[6]
is taken for the study.
This route is one with the highest volume routes within this program.
It serves the eastern part of Indonesia, notably the North Maluku group of islands. The detail of the route is presented in below map and table.

| Port Depart | Port Arrive | Distance (Nautical Miles) |
|---|---|---|
| Tj Perak | Tidore | 1216 |
| Tidore | Morotai | 156 |
| Morotai | Galela | 72 |
| Galela | Maba | 144 |
| Maba | Weda | 139 |
| Weda | Tj Perak | 1213 |
A little bit about the 'Sea-Toll' program, Indonesia is an archipelagic nation with thousands of islands, maritime transportation is indispensable to our country's infrastructure. In response, the Government of Indonesia launched the “Sea Toll” program in 2015. It's an initiative aimed at enhancing maritime logistics and connectivity among the archipelago's islands, focusing on reducing logistics costs and equalizing the price of goods across regions, particularly in remote and underdeveloped areas.
Data & Methodology
Following table summarize the subject of the comparison.
| Variables | Values | Unit |
|---|---|---|
| Vessel | KM Logistik Nusantara 5 | n/a |
| Longest Intra-Port Distance | 1216 | nautical miles |
| Speed | 16 | knots |
| Required Engine Power | 6000 | kW |
| Total Fuel Tank Capacity | 1090 | m³ |
| SFOC for Diesel engine | 23 | ton per day |
| Symbol | Description | Value |
|---|---|---|
| \( p_{ICE}^{a} \) | Annual costs for the ICE | To be calculated |
| \( p_{ICE}^{\text{inv}} \) | Power-specific investment costs (€/kW) | 251.2 |
| \( p_{ICE}^{r} \) | Rated Power for ICE (kW) | 6000 |
| \( A_{ICE} \) | Annuity payment factor | 0.064 |
| \( c_{ICE}^{a} \) | Annually accruing maintenance costs | 0.0045 |
| \( t_{L,ICE} \) | ICE's lifetime | 25 |
| Symbol | Description | Value |
|---|---|---|
| \( p_{B}^{a} \) | Annual costs for the ICE | To be calculated |
| \( p_{B}^{\text{inv}} \) | Power-specific investment costs (€/kW) | 460 |
| \( C_{E,B} \) | Battery energy capacity (kWh) | 622 |
| \( A_{B} \) | Annuity payment factor | 0.064 |
| \( t_{L,B} \) | Battery electric's lifetime | 25 |
As for the physical model, the volume and weight of the required energy will be compared. For the ICE ship, the total fuel storage tank volume represents the required energy for the voyage, whereas for the battery electric ship, it will use the volume and weight of the require battery system. The rest of the assumptions can be summarized in the following table. The charging rate and fuel oil price are local data in IDR, it will be converted to EUR during the calculation.
| Variables | Values | Sources |
|---|---|---|
| Interest Rate | 4 % | Own estimate |
| Lifetime | 25 years | Kistner et al.[1] |
| Power specific investment cost for marine diesel engine | 251.2 EUR/kW | Kistner et al.[1] |
| Energy specific investment cost for battery-electric motor | 460 EUR/kWh | Kistner et al.[1] |
| Cell specific battery energy capacity | 733 Wh | Kistner et al.[1] |
| Annual maintenance cost factor for marine diesel engine | 0.0045 | Kistner et al.[1] |
| Battery charging price | 996.74 IDR/kWh | PLN |
| Marine fuel oil price | 18,950 IDR/Liter | Solar industri |
Synthesis
The resulting estimation is presented in below graph. The Port of Arrival illustrates the voyage segment within T-10 route, for example 'Tidore' represents the voyage from Surabaya to Tidore, and 'Morotai' represents the voyage between Tidore to Morotai. The intention to show this result is to illustrate the effect of segment distance and passage time to the economic model. The y-axis quantifies the total annual costs, distinguishing between the annualized investment cost—depicted as the solid base of each bar—and the recurring refueling or charging costs, shown as the upper stacked portion.This analysis presents findings that are in line with the research by Kistner et al. (2023) [1], particularly highlighting the economic challenges associated with the application of battery-electric propulsion systems for extended maritime routes. A case in point is the route from Surabaya to Tidore, covering a journey of approximately three days. For this passage, the annualized investment cost of implementing battery-electric propulsion is observed to be about 50 times higher than that of traditional marine diesel engines. This stark difference underscores the current limitations of battery-electric systems for longer voyages where cost-effectiveness is a pivotal concern.
Conversely, for shorter routes such as the 72 nautical mile stretch from Morotai to Galela, which is completed in just 4.5 hours, the cost disparity narrows considerably. Here, the annualized investment cost for electric propulsion is merely three times that of diesel engines - a significantly reduced gap compared to the longer T-10 route from Surabaya to Tidore. This observation opens up an intriguing line of inquiry into the viability of electric propulsion for mid-range maritime routes, particularly those spanning 300 to 700 nautical miles in the near future, where economic and operational efficiency may reach a tipping point. Adding a midway stop for the longest route might reduce a lot the investment cost, for example berthing at Makassar prior to continuing to Tidore.
| Diesel Engine Propulsion | Battery-Electric Propulsion |
|---|---|
| Total fuel tank volume is 1090 m³ | Total battery system volume is 3000 m³ |
| Maximum fuel weight is 860 metric-ton | Total battery system weight is 2958 metric-ton |
From a physical modeling perspective, this analysis used the longest route within our study, the 1216 nautical mile trek from Surabaya to Tidore. Findings indicate that battery-electric propulsion systems would require approximately threefold the volume and weight compared to conventional systems. Such an increase has direct implications on cargo capacity, potentially reducing available space and weight for freight. Notably, even if batteries were to occupy the space typically reserved for fuel tanks, an additional 2000 m³ would still be necessary to house the battery-electric system.
It is important to note that these calculations have not accounted for the environmental costs associated mainly with the marine diesel engine, such as carbon tax, nor the trend of price reduction in battery technology. It will be interesting to observe how incorporating these factors might alter the economic feasibility of electric maritime propulsion system.
References:
- Kistner, L., Bensmann, A., & Hanke-Rauschenbach, R. (2023). Potentials and limitations of battery-electric container ship propulsion systems. Energy Conversion and Management: X, 21, 100507. https://doi.org/10.1016/j.ecmx.2023.100507
- Kersey, J., Popovich, N. D., & Phadke, A. A. (2022). Rapid battery cost declines accelerate the prospects of all-electric interregional container shipping. Nature Energy. https://doi.org/10.1038/s41560-022-01065-y
- Li, J., & Jia, Y. (2020). Calculation Method of Marine Ship Fuel Consumption. IOP Conference Series: Earth and Environmental Science, 571, 012078. https://doi.org/10.1088/1755-1315/571/1/012078
- Tarif Tenaga Listrik. PLN. Retrieved from https://web.pln.co.id/pelanggan/tarif-tenaga-listrik
- Harga Solar Industri B35 & MFO. Solar Industri. Retrieved from https://solarindustri.com/berita/harga-solar-industri-01-14-januari-2024/
- Keputusan Direktur Jenderal Perhubungan Laut Tentang Penetapan Jaringan Trayek Penyelenggaraan Kewajiban Pelayanan Publik Untuk Angkutan Barang Di Laut Tahun Anggaran 2023 . Dirjen Perhubungan Laut. Retrieved from https://ppid.dephub.go.id/fileupload/informasi-berkala/20230512143919.SK_Jaringan_Trayek_Tol_Laut_TA._2023.pdf